Thomas Sowell wrote Vision of the Anointed in 1995, and didn’t mention climate change. Yet such is the insight of the man that what he wrote was prescient, pertinent and 100% applicable 15 years later. Our battle today follows a similar pattern to battles over many other social policies. Sowell discusses The War on Poverty, sex education, affirmative action, discrimination, crime, infant mortality. They’re unrelated to climate science, yet the tactics repeat ad nauseum.
We fight to test policies with empirical evidence through polite discourse, while those who want influence and money have an arsenal of tools at their disposal to muddy the search for truth. The anointed substitute baseless declarations, flawed assumptions, and irrelevant motivations for real arguments.
How many areas of public policy have a genuine, no name-calling, clean cut debate about what works and what doesn’t?
Just like Earth’s atmosphere, it’s the feedbacks that matter.
Self Congratulation as a Basis for Social Policy
Dangers to society may be mortal without being immediate. Once such danger is the prevailing social vision of our time–and the dogmatism with which the ideas assumptions, and attitudes behind that vision are held.
It’s not that these views are especially evil or especially erroneous. Human beings have been making mistakes and committing sins as long as there have been human beings. The great catastrophes of history have usually involved much more than that. Typically, there has been an additional and crucial ingredient–some method by which feedback from reality has been prevented, so that a dangerous course of action would be blindly continued to a fatal conclusion. Much of the continent of Europe was devastated in World War II because the totalitarian regime of the Nazis did not permit those who foresaw the self-destructive consequences of Hitlers’ policies to alter, or even to influence, those policies.
Jo is away from the computer for some fun and relaxation with her family.
Jo being “off-line” leaves the controls of this blog in the hands of volunteer moderators. 🙂
This time while the Cat is away:
Many regular posters here use web links to make their point(s). If those links could be found easily, others could use them both here at JoNova and also if we blog elsewhere.
What do you say when the Big PR bell is rung?You know the litany: “2010 was the warmest since measuring began, and the previous decade was also the warmest decade on record.” (eg The AGE)
Sure, and the world has been warming for 300 years, long before the industrial revolution. The trend hasn’t changed as our emissions rose. No one knows exactly why it started rising back then, but it wasn’t CO2.
Sure, and the records have been set with thermometers like this one (next to concrete and exhaust vents — see below). There probably weren’t too many car parks or air conditioners in 1880 either. Not to mention the non-random adjustments, and that mystery about how 75% of thermometers are ignored.
Nothing about the “hottest year ever” is meaningful or significant on a big scale. Nor is anything even certain about it on the 150 year scale. After all, most of the original raw data records are missing aren’t they?
Here are some graphs:
This is just a cycling warming on a long term trend that started before CO2 became an issue:
The big temperature picture. Graph and insight from Dr Syun Akasofu (2009 International Conference on Climate Change, New York, March 2009)
In Australia we’re all watching the flood news unfold. Right now, two friends are trapped without electricity in an apartment building in inner Brisbane. The ground floor below them is inundated. Troy and Jan wrote on Tuesday night that they had little warning their exit route would be cut off, and by the time they knew it was, it was too late to leave. They were rushing to cook meals before the electricity went off and were expecting to lose the car. — My thoughts go out to them, and to those who are so much worse off. Which brings us to questions about what might have been.
The major dam above Brisbane, the Wivenhoe, may have missed the opportunity to release serious quantities of water in the week or two leading up to the major flood peak. Because the Wivenhoe was almost completely full, when the big danger-day came they could do very little but eek out a small amount of water into what was a rising flood, with little capacity to absorb the massive flows. There are hard questions to be asked about water management.
It’s one of the severest La Nina seasons on record, and with above average rainfall already recorded across much of Queensland and parts of the state in flood, should the dam have been partially emptied when it was safe to release the water? Would it have made a significant difference to that wall of water if they had? — JN
How SEQ Water failed “Flood Mitigation 101”. (13/01/11)
On the morning of 12th January, the day before the flood peak that inundated the Brisbane CBD and much of Ipswich, Brian Williams of Brisbane’s Courier Mail, in a masterpiece of misreporting by omission, reported that releases from Wivenhoe Dam were to be reduced from an overnight peak of 645,000 megalitres/day to 205,000 ML/day with the stated aim of “allowing the Bremer River and Lockyer River to subside, thereby easing floods on Brisbane downstream.”
This is one of those scratch-your-head moments when a skeptic just has to ask “Could the modelers really have overlooked that?” Given the $79 billion odd dollars in research and the billions of dollars bet on the models, it seems hard to believe. Then again, the same team didn’t ask any hard questions when one study overturned hundreds of other studies that showed it was warmer 1000 years ago, they are the people who think it’s ok to hide declines, hide data and dodge FOI’s. This is, after all, the Team who call fertilizer — “pollution“. Maybe a couple of extra Watts per square meter could have slipped by?
When a greenhouse gas absorbs infra red, its molecules emit in a random direction — so half of its emissions are emitted up, towards space. This is kind of the key to the matter.
George is an electrical engineer, and since I’m married to one I know that EE’s are used to dealing with complex feedback loops in systems. George uses the points we know — incoming solar radiation, outgoing radiation, the Stefan-Boltzman equation — and shows in a simple and logical fashion that the numbers all balance.
But once we have this un-obfuscated picture of radiation flows from George, we can see the potential for some double-counting going on in a crucial climate calculation.
Everybody who’s anybody in the climate calculations knows that if CO2 doubles, the IPCC reckons that it is supposed to be equivalent to adding 3.7 W per square meter of net extra incoming solar energy (which means “heat”) to Earth’s big budget. Of course, adding extra CO2 to the atmosphere really just reduces the amount of radiation out to space. The flow from the sun is not increased; the 3.7 W/m-2 increase in forcing is solely due to less radiation leaving the earth.
The 3.7 W/m-2 is calculated from line-by-line spectral calculations, but does it correctly include changes to both the 93 W/m^2 going straight through the transparent window to space and the 146 W/m^2 absorbed by the atmosphere and then escaping to space?
The 1.2C no-feedbacks temperature increase from CO2 doubling is calculated by applying Stefan-Boltzman to the top of the atmosphere, where it is 255K: a surface around 255K has to warm by 1.2C if it is to emit the extra 3.7 W/m-2 required to keep the earth in radiative equilibrium when the CO2 doubles. We apply this at the top of the atmosphere because we can — we know the fluxes there and all the heat flow is by radiation. But we really want to know the change in temperature at the surface — a very different, and messier, situation. Obviously the radiative flows at the surface are only changed by about half as much due to a CO2 doubling, so presumably only about half the full 3.7 W/m-2 applies to change the surface temperature.
Like Judith Curry (see her blog, Part I and Part II), we think the calculation of a 1.2C warming for CO2 doubling is opaque and uncertain, and open to challenge. On the face of it, it may well be half that, around 0.6C. (And it’s not like those who aim to alarm us, ever exaggerate or hide behind obscure and unexplained data or calculations, is it?)
The flow-on effects of this would run rampant through the scenarios and projections. Instead of causing 1.2 degrees C of direct warming (as per Hansen et al 1984), doubling CO2 would only lead to 0.6 C, and all the feedbacks apply to that. So the “average 3 or 4 degree” estimate for the mass of climate models comes back to 1.5 – 2 degrees, and the skeptical view, which points at empirical evidence for negative feedbacks (Lindzen and Spencer) would roughly halve the 0.6C which makes 0.3C, and that converges nicely with the Miskolczi estimate of around 0.24 C.
Guest Post by George White
Evolution of an Energy Budget
There’s 341.5 W/m2 of average incident solar power and the average albedo is 0.3, so 239 W/m2 arrives at the surface and 102.5 W/m2 is reflected into space. Any solar power absorbed by the atmosphere will have half directed back into space and which is considered as incremental reflection and included in the albedo. That returned to the surface is included in the 239 W/m2 . Both the solar constant and the albedo are measured and uncontroversial.
The “Carbon Capture report” tucks away more meaningless data about you than you could hope to (not) have to read: Factoids you didn’t know existed, don’t want to understand and never cared to compare.
There is so much money sloshing around in The Big Scare Campaign, someone at the University of Illinois has created a massive database with an amazing array of superficial-to-the-point-of-meaningless data. Have you ever wondered what the NewsTone of joannenova.com.au was — and if I told you it to the second decimal place, does that change anything about the weather? Apparently, “0.36” and slightly “green”, whatever that means. The crew-with-too-much-money have created some autobot crawlers (presumably) that check language on tweets and posts and rate it all for polarization, activity, personalization, blah blah and to the nth blah.
Look closely and you can see part of the GNP of the West evaporating. Pfft.
I can’t be bothered trying to figure out what these indicators mean. None of it is obvious, the numbers don’t match up with the number of tweets or posts I’ve done, nor the number of tweet “followers” I have, nor any particular fact I can figure with a 2 minute glance. But hey, it’s flattering in an inane, passing kind of way. (ie not much).
Just when you think things are as inanely silly as they can be, they raise the stakes. It’s a game of double or nothing in the race to the bottom. The close common interests of three big government agencies is fragmenting and instead of skeptics launching the FOI’s, this time, the BBC is.
Just in case there is anyone who doesn’t know, the UK Met predicted a winter a couple of degrees above the usual. Then supertankers of snow turned up and dumped on the nation, surprising people, and making life difficult for everyone who hadn’t made arrangements for the return of the British Blizzard and the coldest December on record. The UK Met, having got it completely wrong, decided the best course of action was to announce post hoc that actually they did get it right, really, they predicted cold weather, but they didn’t tell the public, they just told the politicians. The politicians apparently asked them not to let on to the public, or so the story goes, and the plot thickens.
One way or another someone is using tactics with all the forward thinking you’d expect from a five year old. If the Met office is not incompetent then the implication is one of implacable dishonesty from either the BOM or the UK government (or possibly — both).
The BBC reported it, without asking too many hard questions, which makes them look a bit silly too. Now, instead of the Big Scare Campaign Team working together, three big formerly aligned groups are fighting for their own cred. The BBC versus the Met, versus The Government.
Back on August 6, 2010, when the UK BOM was predicting a warm winter, and every Met Agency in the West was already declaring that 2010 would be the hottest year ever, Bryan Leyland predicted (on a global scale) that before the end of the year, there would be significant cooling. As you can see from the chart, this is exactly what happened.
Parking the SOI index (the blue line) 7 months into the future suggests things may get cooler still as the temperature (red line) often follows the trend. (Click for a larger image.) Note, the SOI is shifted 7 months forwards in time, and the scale is inverted.
Before anyone scoffs that the El Nino’s are usually followed by cooling, and the SOI indicator is well known, ponder that the well fed agencies of man-made-climate-fame weren’t telling the public that a big-chill was on the way and they ought to stock up on salt and red diesel. (And maybe take their own deicing fluid to the airport.*)
What’s ominous is the potential cooling that’s still in the offing
It seems a warmer climate might be bad, but a colder one is deadly.
Once upon a time, people thought that overpopulation triggered crashes, but in this study by Lee and Zhang the hard numbers suggest instead that it was climate, and of course, it’s not the warmer kind of climate that causes the problems but the colder kind.
Malthusian cycles of population boom and bust aren’t the drivers here (though presumably having a large population means there is little buffer when the deadly cold spells hit).
From NIPCC: Cold Periods caused population crashes in China over the last millenium
…there were 5 major population contractions in China between 1000 CE and 1911, and all of them occurred in periods with a cold climate, when mortality crises triggered population collapses. [Abstract]
How much fun can you have in a long frost? Almost every kind of uprising, pain or plague.
In one population crash, the losses were as high as 49% of the peak. In the face of a 50:50 death rate, “perspective” doesn’t seem like quite the right word.
You have to feel sorry for him. He’s genuine. He’s stressed to the point of mania. And it’s all for nothing.
But as Brice Bosnich says, Hilarious; bring the back to front canvas jacket, rubber spoon…
Greg Craven posted his infamous AGU speech and asked us to share it. Craven is absolutely right in a chain of logic except for one ever so small point, in the first link. His chain is anchored to his Gods of Science. He doesn’t question authority. Everything else is an error cascade, and he’s over the waterfall. He’s just done Niagara in a tin-can.
I hope he makes it.
The irony is he’ll devote hours to “understanding” the official establishment version of events, and three years working non-stop to promote that, but nothing to understanding why people are unconvinced. He’s living in the matrix — he thinks the punters are dumber than him, and they’re being exploited by a “ruthless denial machine” — meanwhile his religious zeal, and blind faith in authority is passively exploited by a ruthless power-seeking money-hungry machine.
Shame, if only someone had taught him the fallacy of argumentum ad verecundiam. All those good intentions could be used to help the daughters he loves so much. Instead he willingly feeds the establishment that wants to take away their freedom and shackle them for life to be vassals for bureaucrats and banksters. (We fight for your daughters too Greg).
He faithfully ignores the missing stations, the smearing of measurements across 1200km, the thermometers in car-parks, the endless shifting excuses, the un-falsifiability of their predictions, the weather-balloon results, the polite questions from skeptics and the pattern of deceit in some of his hallowed hero scientists who somehow repeatedly hide and lose their records.
Here in Australia we’re copying techniques from tin-pot tyrannies. When the government wants a “consensus” that they know they have no way of achieving, they fake it. People in suits declare (with no hint of irony) that Business Needs Certainty (which means: certain-taxes, guaranteed imposts, global handicaps, Mmmm. Yes. Please).
The Ultimate State of Business Certainty will be found when the idea of costing carbon is dumped for good, laughed into history, and is mocked on whatever version of Saturday Night Live is running at the time.
Frankly the case cooked up as “Business Needs Certainty (so tax us)” is an inanity-cake with cherries on top. Can we bake it in public, chop and serve it with a smile, and all enjoy the joke together?
Is anyone kidding that there is any better kind of “business certainty” than when companies know for sure they won’t be hit with unnecessary taxes based on corrupt science? How about a future where a Government guarantees to get out of the way and stay out?
Gilllard has painted herself into a corner where the only escape hatch is “a consensus” (well not just any old consensus, but a fully predetermined one — hers).
Rule number one of the Strategic Bluster is to win the argument by simply declaring you’ve won. But Advanced Bluster 101 is better: Don’t even acknowledge there was a competition in the first place — simply proceed as if Conclusion A is so obvious that there was never even a need to discuss it. Move along people.
The New Yorker has such an interesting article it’s already generating discussion here, so it deserves a thread of it’s own. It describes a true modern paradox, namely that so many good studies can show interesting “significant” results, yet very few of these turn out to be genuine repeatable findings, and frustrated researchers struggle to get similar results, and it’s almost as if, the harder they try, the worse it gets. Many researchers across disparate fields are noticing an odd trend that the effect they thought was so solid, appears to mysteriously “wear off” as the years and the repeat trials go on.
It’s a sober warning to all of us to search hard for the truth hidden behind variables we are not even able to name yet, let alone measure, and to be ever vigilant about variables we can name, like “publishing bias” and “selective reporting”.
Annals of Science The Truth Wears Off
Is there something wrong with the scientific method?
by Jonah Lehrer December 13, 2010
These are quick quotes from a 5 page article. It’s well written, and worth reading in full.
But now all sorts of well-established, multiply confirmed findings have started to look increasingly uncertain. It’s as if our facts were losing their truth: claims that have been enshrined in textbooks are suddenly unprovable. This phenomenon doesn’t yet have an official name, but it’s occurring across a wide range of fields, from psychology to ecology. In the field of medicine, the phenomenon seems extremely widespread, affecting not only antipsychotics but also therapies ranging from cardiac stents to Vitamin E and antidepressants: Davis has a forthcoming analysis demonstrating that the efficacy of antidepressants has gone down as much as threefold in recent decades.
What is most astounding about the human race is that people like Erhlich, who predicted vast coastlines would be evacuated due to rotting fish by 1980, or Oppenheimer with a black blizzard of sand covering a continent (by 1995), people who have long proven to be arrant failures at making predictions are still invited to speak or write. Some commentators still mention their name or quote them with a straight face.
Surely it takes a special kind of braggadocio and a certain delusion- of-grand-proportions for these would-be leaders to appear in public after predictions like these?
1 “By the year 2000 the United Kingdom will be simply a small group of impoverished islands, inhabited by some 70 million hungry people … If I were a gambler, I would take even money that England will not exist in the year 2000.”
2 “In ten years all important animal life in the sea will be extinct. Large areas of coastline will have to be evacuated because of the stench of dead fish.”
Ehrlich, speech during Earth Day, 1970
3 “[By] 1995, the greenhouse effect would be desolating the heartlands of North America and Eurasia with horrific drought, causing crop failures and food riots…[By 1996] The Platte River of Nebraska would be dry, while a continent-wide black blizzard of prairie topsoil will stop traffic on interstates, strip paint from houses and shut down computers.”
It’s true, 97%-of-experts agree the world is going to hell in a handcart. It’s part of the frontline toolkit used by the Big Scare Campaign.
Do a google search on “97% of climate scientists agree” and 3,920,000 links turn up.
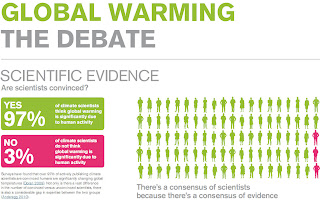
Like everything in the Big Scare Campaign, a tiny semi-dried kernel of truth becomes inflated, distorted and repeated into a planetary group chant. Here’s how one small online survey was distilled to the point where the opinions of 75 climate scientists doing a 2 minute online survey could be headlined up as: “97 percent of scientists say man-made climate change is real”. (Worse — for those of us with a scientific bent — this mantra to the imaginary Gods of Science is even referred to as “Scientific” evidence.)
In August 2010, the HockeySchtick site pointed out the 97% figure was just 75 self selected scientists. As as example of the way the chant is spun, the author, “MS” linked to the unSkepticalScience site and the screen image that John Cook posted in an article titled: “Visually depicting the disconnect between climate scientists, media and the public”.
…
Don’t miss the fact that the graphic is subtitled “SCIENTIFIC EVIDENCE”. Presumably, the author, Matthew Glover, “thinks”, or wants the audience to think that this is what science is about. Opinions. Inclinations. Good guesses.
Note the comical text at the bottom of the erstwhile army of casual-but-concerned greens. “There’s a consensus of scientists because there’s a consensus of evidence.” Admire just how much sloppy equivalence can be packed into one phrase: Firstly, the opinions of 75 climate-related scientists is implied to equal a consensus of all scientists; secondly, “there’s a consensus of evidence?” Since when does evidence form a consensus? Ponder an image of a room full of scientific papers nodding meaningfully at each other, or the local Professorial Fellow of Pseudo-psychology at East Quando College interviewing thermometers.
Of course it is really great that Jo has some leisure time! Jo has mentioned us “unsung moderators” before but she also left us with keys to the shop. So maybe we can have some fun while she is away. Pick your topic. Post anything you want (within reason*) and see what happens!
When Jo gets back she can decide if this stays or is erased forever.
From all of us moderators, have a HAPPY NEW YEAR !
Many thanks FROM the unsung moderators TO all of you for the comments and great thinking that makes this possible.
P.S. It might be time to upsize your chocolate commitment 🙂
Piers Corbyn ofWeatherAction appears to be getting noticed (finally). Recently, the Telegraph reported on The man who beats the Met Office. But, some people (especially outside the UK) don’t seem to realize Corbyn has been doing this for a long time. He started placing bets on his predictions way back in 1990, and set up his his long range forecasting business in 1995. His accuracy during a 6-month period of 2008 at predicting extreme weather events in narrow time windows was audited at 85%. WeatherAction sells forecasts that are 30, 45, and 60 day advance notices. Could you imagine our BOM giving us warnings now about a storm or flood on, say, February 23 – 25th 2011? Try to picture the weather girl suggesting anything like that in the local Channel Nine Weather Update.
The BOM in the UK have said they don’t do seasonal forecasts (“BBQ-summer” and “mild-winters” no more). Yet, here is Piers, still putting his name to forecasts, not just of a seasonal nature across an entire country, but for particular dates and particular regions.
If the CSIRO or BOM were really interested in predicting the climate, they could, say, pay to fly in a consultant who had a far better record than they do, and immediately set up an Australian branch. The NHMRC is prepared to spend $350,000 of special initiative funding to Identify connections between climate, and the health and well-being of Indigenous people in the tropical north of Australia. Can’t a government department find a similar amount to kick start a step-wise improvement in our long range forecasts? Surely the health and well being of our farmers (not to mention their finances and tax contributions) would be improved if the meaning of the “long” in long-range-forecasts was extended beyond next Wednesday.
Corbyn sometimes get’s it completely wrong (it is the “weather” after all), but make no mistake: He has literally been beating the Met Office at their own game for years. He was so good, the bookies stopped him placing bets on the weather, because they were trying to use BOM forecasts, and he kept winning.
The immovable wall met the inflexible mind this week. The bitterly cold weather brought out some spectacular cases of cognitive dissonance. The Greg Graven’s who were overcome with passion, and the Monboit’s who were overcome with the complete “suspension of disbelief” whilst hunting for ways to rationalize their faith in a theory. Too warm? Too cold? It doesn’t matter, what ever it is, it matches a model somewhere, somehow, post hoc, ad hoc, hoc post, whatever…
I’m betting we’ll see more of those implosions in 2011.
Thanks to all of those who helped me this year — with advice, information, tips, and chocolate. Thanks to the unsung moderators too. 🙂
Apologies for all the times I forgot to say thanks to the right person for tips — a few weeks ago my intray seriously did reach 21,000 messages and the magic 4G mark, whereupon my email functionality collapsed, the computer crashed, and then I learnt the importance of something called “compacting”. I would like to thank people more often, and am conscious that I didn’t always get it right.
I’ll be taking a few days off and posting less often over January. I wish I could keep up this pace, but there are other commitments at hand. Please add your name to the email list (see the “register for emails link” top right) if you want me to notify you of new posts.
UPDATED: Posted the full Pointman article instead of the much abbreviated edit version. Thanks to Pointman.
Hacked or leaked?
Pointman argues the case for the emails being leaked from inside. Part I of his thesis is that an expert hack takes a lot of money, patience and a rare personality. (And after reading his article I believe him.) In Part II Pointman suggests that there is not a lot of money or inclination to pay such an expert. Call me unconvinced on this second clause. Even though I’ve seen no evidence of big dollars at work in the skeptic case* I can imagine in any market worth 130 odd billion per annum that there would be players with handy shorts-ready-to-place who might like to pull some strings.
That said, the fact that the police investigation into the leak or hack has failed to find any answers combined with the obvious motivation for any half honest civil servant with a modicum of altruistic honor to act as a whistle-blower, means I find the whistle-blowing theory much more believable.
The ilk of the money-driven sociopathic derivative trader who makes money from shorting markets, and would have the balls to organize an illegal hack, doesn’t strike me as the type of person who also read Watts Up With That or Climate Audit on their weekends. Without the in-depth knowledge of what they were looking for in the emails, it seems a tad hard to believe the money market would be hunting for ten year old messages from mediocre scientists who might be hiding measurements from Sweden that are recorded in degrees Celsius.
What makes Pointman’s post especially rewarding is the rich insight into the hacker world – – and explained so well. It’s clear he has an unusual expertise, and I appreciated the detail.
Did you know in hacker land there are script kiddies, ascendants, and invisible great white sharks?
Warwick Hughes has spotted a neat trifecta: whether it be rain, maximums or minimums, the BOM gets it wrong.
For this spring the Australian BOM predicted it would be dry and warm, instead we got very wet and quite cold. The models are so bad on a regional basis, it’s uncannily like they are almost useful… if they call things “dry”, expect “wet”.
On August 24 the Australian BOM had pretty much no idea that any unusual wetness was headed their way. Toss a coin, 50:50, yes or no. Spring 2010 was going to be “average”, except in SW Western Australia where they claimed “a wetter than normal spring is favoured.” What follows were 100 year floods, or at least above average rain to nearly every part of the nation bar the part that was supposed to be getting more rainfall. In the chart below, all shades of “blue” got above average rainfall. The dark blue? That’s the highest rainfall on record.
Remember the Great Debate between myself and Dr Andrew Glikson? He’s back – in Climate change denial: The misrepresentation of climate science he calls names, resorts to inventing a mental illness, creates strawmen whom he beats down mercilessly, all the while misrepresenting thousands of scientists who disagree with him, and making statements that can be proven false with a few seconds of Googling.
We are most fortunate that Brice Bosnich managed to pop in and report on what Glikson had to say (below). I wish I could have been there to hear Brice ask those questions….
Glikson knows the main Skeptic arguments, so why did he ignore them?
In the Great Debate of May 2010, Andrew Glikson and I exchanged replies in a five part series that took six weeks and amounted to over 17,000 words, 26 graphs, and dozens of references. It’s the only long serious climate debate in writing that I’m aware of. He was unable to provide convincing empirical evidence to back up his claims of impending catastrophe. He asked if he could respond again, I said: “please do”. But so far he hasn’t come back with an answer. In the six months since then he has kept a subdued profile, possibly licking his wounds. (It must be tough being beaten by a housewife.)
Here’s the bizarre thing: he knows what I’ve written — his response to it is in writing — so he can’t pretend to not have examined my skeptical arguments. He also knows he can’t answer my criticisms, and yet he stood up last week at ANU claiming he had examined “climate denial articles” and came to five conclusions which, dare I suggest, (is there any other word for it) are in… denial?
Then as if that is not enough, I now find that Brice Bosnich (as in, emeritus Professor Bosnich, fellow of the Royal Society) has presented a skeptical summary at ANU recently, which may have what inspired the Glikson anti-skeptic speech. So did Glikson respond by specifically talking to Brice’s points? Apparently not so much. Instead he savagely kicks down odd things he found on obscure internet sites or in letters to editors. It’s a kind of university reply to beer-and-barbeque skeptics, while Glikson ignores professorial skeptics, and dodges the skeptical points he can’t answer. As always, it is just another PR exercise dressed up as science.
The mental contortions for him to hang on to his faith in a theory are something to behold.
Is there a denier in the house?
Take this point: “Skeptics avoid peer review articles”. Like wow. Seriously? You have to go out of your way to find skeptics arguments without peer review references or links to articles with peer reviewed references in there somewhere.
If Dr Glikson had done a Google search for the blindingly obvious keyword combo: “climate skeptics, peer reviewed literature,” in just 0.28 seconds he would have turned up 800 peer reviewed papers (and that’s just the second link). As it happens, he didn’t even have to do that, as I collected, explained and listed 40 of the most important peer reviewed references for him in my replies to him in our debate. This is not just passive denial on his part, it’s active.
Who needs peer review when you have pop psychology?
Look out for “Climate Change Denial Syndrome”. Dr Glikson (paleo geologist) tries to avoid discussing climate science (you know, evidence and such) by labeling his opponents as quasi mentally ill. The handy thing about this is that it forestalls a scientific debate entirely. Thus the doctor of old rocks invents a syndrome and plays psycho-analyst.
Yes, this is another case study in the intellectual collapse of Australian Universities.
Shame.
Brice Bosnich trekked along and this is his emailed summary of the event
Brice Bosnich
The ANU Climate Institute, led by re-tooled service crystallographer Director Will Steffen , put on a lecture on climate change denial by a member of the institute, Andrew Glikson, a re-tooled geologist. This lecture was, I think, in response to the two I gave the previous week, which seemed to have caused some disquiet among the believers who now needed some solace. This email is to an email buddy of mine in West Australia.
Title: Climate Change Denial and The Misrepresentation of Climate Science
———————————————————————-
Thought you might be interested in my reaction to Glikson’s lecture. As we went into the lecture hall there, at the door, was a large banner announcing the ANU Climate Institute. I sat up the front and could observe Mr Steffen. Glikson was introduced by Steffen and proceeded to the lectern in a pair of pants whose legs were at least 20 cm too long, and as a consequence the piled up pant legs gave the impression that he was walking on springs. As he spoke in a thick, gelatinous Polish accent, I could discern the approving nods of Mr Steffen.
What Glikson had apparently done was to trawl the internet and newspapers to find all sorts of scientific nonsense which purported to debunk AGW. Nonetheless our ever vigilant defender of the faith was there ready to slay the dragons of denial. After each stroke of his trusty intellectual sword he added a self-satisfied bon mot, which was appreciated by the admiring assemblage.
As the story unfolded he graced us with a farrago of falsehoods about the sorry state of the climate due, of course, to the perfidy of the deniers. Included among these terrifying events was that the earth’s poles were warming by 5 degrees C consistent with theory, the tropospheric temperature inversion (hot spot) was real as shown by Sherwood, there has been an increase in hurricanes, earth quakes, droughts, floods all as predicted and the oceans were rising from 0.1 mm/year in 1850 to over 3.0mm/year now. There were similar other incisive observations to support his case. He finished up by saying the press does a very poor job of giving the correct view of climate science, even the ABC is wanting in this regard.
At the end of the lecture I asked the first questions. I asked why he bothered to give the lecture because anyone could go to the internet and find scientifically outrageous nonsense from both sides of the argument. Answering this stuff was a pointless Sisphean task. He and Steffen appeared confused. I then asked from where he got the 5 degree C warming of the poles number, I also said there has been no increase in hurricane intensity nor in frequency recently, there has been no increase in droughts nor flooding over the last 100 years worldwide and… At this stage he stopped me because he said he could not remember “all those questions”. But he said that he would provide me with a reference showing how satellites measured the temperature at the poles. This was seconded by Steffen.
I pointed out that this would difficult since satellites did not measure beyond about 82 degrees L.
We use cookies to ensure that we give you the best experience on our website. If you continue to use this site we will assume that you are happy with it.











Recent Comments